Predicting the Spread of
Infectious Diseases
Throughout my PhD, I focused on statistical modeling, but it was during the “hack4health”, a machine learning hackathon, organized by the Robert Koch Institute and Institute of Cognitive Science, that I began working with Bayesian methods. My team built a Bayesian model for predicting the spread of infectious diseases, for which we won a special award. That project showed me how useful Bayesian inference could be, particularly in incorporating prior knowledge into the model.
As part of the award, I spent two months at the Robert Koch Institute in Berlin, working on the model and applying it to real epidemiological data. I also got the chance to lead a research project between Osnabrück University and the Robert Koch Institute. This experience helped shape the direction of my thesis, making Bayesian inference and interpretability of machine learning methods a central part of my research. As a result of our project, we published a paper titled “A Bayesian Monte Carlo Approach for Predicting the Spread of Infectious Diseases”. The accompanying code can be found here.
Epidemiological models are important for guiding public health decisions, as seen during the coronavirus pandemic, where data-driven policies relied heavily on accurate predictions. Clear communication of these predictions helps maintain public trust and supports informed decision-making.
As part of this work, I also explored how visualizations can help both experts and the public interpret disease predictions and risks. This formed the basis of a conference poster for the EU Data Viz conference, where I presented the role of public health data and visualizations in communicating predictions of infectious diseases.
Challenges in Disease Modeling
Public health agencies have the responsibility to detect, prevent, and control infections in the population. In Germany, the Robert Koch Institute collects a wide range of factors, such as location, age, gender, pathogen, and further specifics, of laboratory-confirmed cases for approximately 80 infectious diseases through a mandatory surveillance system.
Predicting infectious diseases means estimating the number of new cases that will occur in various locations over time. These models rely on two key dimensions: time, which uses past case counts, and space, which tracks where new cases emerge. However, infectious diseases are dynamic, cases interact with one another, which leads to new outbreaks. This is why it's crucial to build models that capture spatio-temporal interactions to improve predictions. Additionally, incorporating prior knowledge about diseases, seasonality, and trends can significantly improve these models.
One of the main challenges in predicting infectious diseases is creating a model that allows domain experts to understand disease dynamics and predict case counts and locations over time, which is vital information for deciding on public health measures.
Working with epidemiological data also presents its own set of challenges. In Germany, for example, epidemiological data is collected at the county level (German Landkreise), which ranges from 150,000 to 800,000 people. This relatively low resolution directly impacts the spatial accuracy of infection predictions. Further, administrative boundaries can be irregular, influenced by historical divisions, and sometimes include enclaves or exclaves. However, diseases spread with human movement, often crossing boundaries and making it more difficult to model spatial spread. To capture spatio-temporal interactions more accurately, we need to move from the abstract idea of neighboring regions to their actual physical boundaries. Administrative divisions are also subject to change due to population shifts or political and socio-economic transformations. As populations grow, areas may split, or merge, further complicating the modeling process.
In addition to epidemiological data, demographic and socio-economic factors are crucial for accurate predictions, because viruses can spread differently across age groups or professions.
A Bayesian Model for Infectious Disease Prediction
We developed a general, interpretable model to capture the spread and spatio-temporal interactions of infectious diseases, which we call Bayesian Spatio-Temporal Interaction Model (BSTIM). We evaluated it on three diseases: campylobacteriosis, rotaviral enteritis, and Lyme borreliosis. The model predicts one-week-ahead case counts for each county in Germany for campylobacteriosis and rotaviral enteritis, and across the federal state of Bavaria for Lyme borreliosis (Figure 1). The model uses spatio-temporal epidemiological data and demographic and political information (e.g., whether counties belonged to eastern or western Germany).

Figure 1: Model scheme. Exemplary contributions from different features, grouped into interaction, temporal, political and demographical components, each evaluated in all counties in Germany for campylobacteriosis in the week 30 of 2016. Each county’s total population is always included as an exposure coefficient. Information about the shape of counties within Germany is publicly provided by the German federal agency for cartography and geodesy (Bundesamt für Kartographie und Geodäsie) (GeoBasis-DE / BKG 2018) under the dl-de/by-2-0 license.
We wanted to create one spatio-temporal model adaptable to various diseases, which led to the choice of a probabilistic generalized linear model with a Bayesian approach. Generalized linear models are suitable for predicting infectious diseases since they allow for non-Gaussian assumptions about the model, which is common in epidemiology. The Bayesian approach allows us to include domain knowledge as prior modeling assumptions, which later helps interpret results.
Bayesian and probabilistic modeling are particularly suited for infectious disease prediction for several reasons. First, Bayesian inference integrates prior assumptions with available data, which helps incorporate expert knowledge into the model. The posteriors can be updated during learning, which makes sure that models learn underlying relationships between variables. Second, Bayesian methods are robust to the limited data often encountered in epidemiology. Third, Bayesian probabilistic models offer not just point predictions, but full probability distributions over both predictions and model parameters, which is essential for estimating uncertainty. This feature is crucial when making high-stakes decisions and helps identify whether additional data are needed to reduce uncertainty. Lastly, Bayesian modeling facilitates the encoding of relationships between variables, improving our understanding of disease dynamics. Since analytical solutions are complex and require a lot of computation power, sampling methods like Markov Chain Monte Carlo (MCMC) can be used, e.g., as implemented in the probabilistic programming software package PyMC.
The model incorporates various basis functions to capture the different factors influencing infection spread (Figure 1). Spatio-temporal basis functions learn interactions within geographical regions and over time. We also model trends, seasonality, and demographic and region-specific information. MCMC sampling was used to estimate Bayesian posterior distributions for model parameters and predictions.
The model generalizes well and learns distinct and interpretable spatio-temporal interaction kernels for each disease. The inferred kernels give insight into the dynamics of each disease and show how parts of the model affect prediction, which makes the model globally interpretable on a modular level.
Visualizing the spread of infectious diseases
Providing information about potential risks of certain diseases in an area, together with prediction maps or risk awareness maps and information about precautionary measures, would benefit the public. This would communicate risks, raise awareness, and enhance safety. While this data is publicly available, it must be processed and presented in an interpretable format to be useful for a broader audience.
Data visualizations and interactive tools can summarize complex datasets and effectively communicate key insights to laypeople and policymakers. The same principle can be applied to communicating predictions of infectious diseases across regions. The BSTIM model predicts the number of infections expected in each county for the next week (Figure 2), along with uncertainty estimates that indicate the model's confidence. Additionally, visualization of model components and learned disease dynamics enhances transparency and interpretability.
To illustrate the performance of our model, reported data and predictions are plotted over time, with quantile ranges as a measure of uncertainty (Figure 2). This type of visualization is valuable for both the public and domain experts. For example, we present one-week-ahead predictions for selected cities such as Dortmund and Leipzig for campylobacteriosis and rotavirus, and Nürnberg and München for Lyme borreliosis. Below the time series, a choropleth map of Germany (or the federal state of Bavaria for borreliosis) displays individual predictions for each county during a given calendar week.

Figure 2: Predictions of case counts for various diseases by county. Reported infections (black dots), predictions of case counts by BSTIM (orange line) and the hhh4 reference model (blue line) for campylobacteriosis (column 1), rotavirus (column 2) and borreliosis (column 3) for two counties in Germany (for campylobacteriosis and rotavirus) or Bavaria (borreliosis), are shown in rows A and B. The shaded areas show the inner 25%-75% and 5%-95% percentile. Row C shows predictions of the respective disease for each county in Germany or the federal state of Bavaria in week 30 of 2016 (indicated by a vertical red line in rows A and B). Information about the shape of counties within Germany is publicly provided by the German federal agency for cartography and geodesy (Bundesamt für Kartographie und Geodäsie) (GeoBasis-DE / BKG 2018) under the dl-de/by-2-0 license.
Domain experts often require different insights beyond predictions. Visualizing learned model components (Figure 3) allows us to inspect how diseases spread in time and space. Similarly, visualizing trends and seasonality (Figure 4) reveals how diseases evolve over the years and highlights periods of higher and lower activity. This capability supports validation and fairness assessments, ensuring that our model aligns with the need for transparent and interpretable machine learning systems, particularly in public health applications.
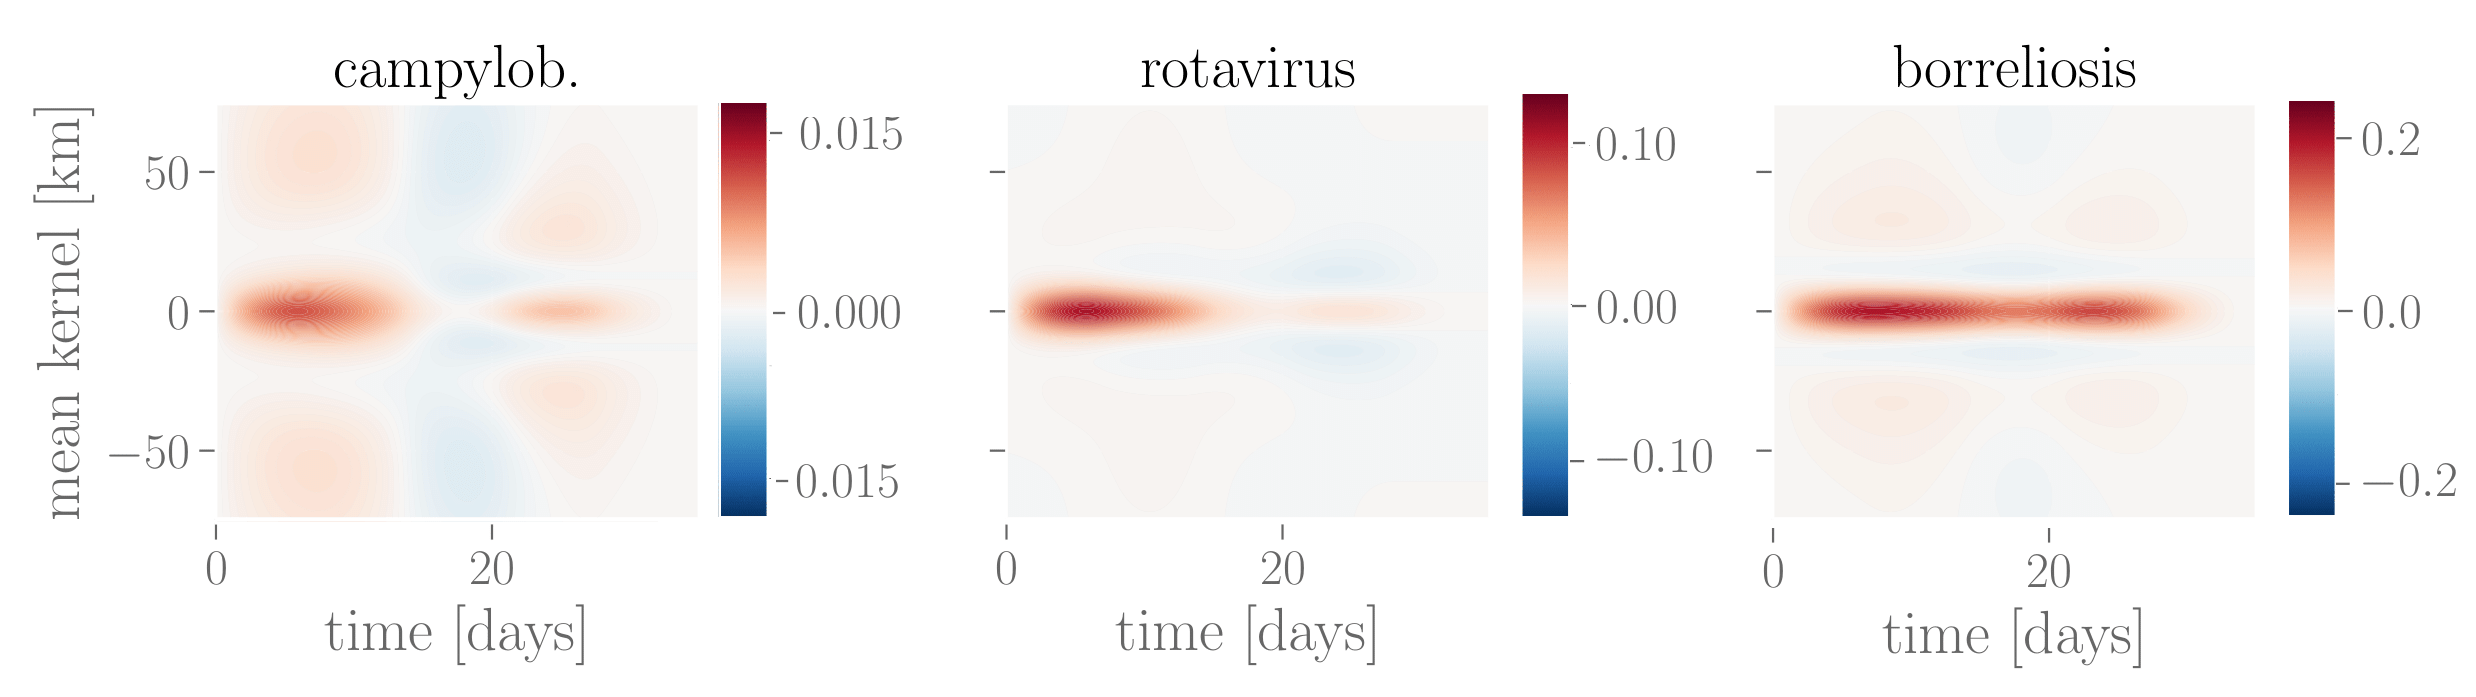
Figure 3: Learned interaction effect kernels for campylobacteriosis, rotavirus and Lyme borreliosis. The mean interaction kernel for campylobacteriosis shows the furthest spatial influence over up to 75 km, whereas rotavirus and borreliosis are more localized within a radius of up to 25 km. Borreliosis exhibits longer lasting interaction effects, extending up to four weeks. The kernel for campylobacteriosis shows a clear drop in the third week after an infection, which might indicate recovery from the disease, but we advise caution against overinterpretation of this negative interaction.

Figure 4: Learned temporal contributions. Periodic contributions over the course of three years (2013-2016) for all three diseases are shown in the row A, trend contributions in the row B and their combination in the row C. Red lines show the mean exponentiated linear combination of periodic or trend or both features through the respective parameters. Dashed lines show random samples thereof; the shaded region marks the 25%-75% quantile.